This macro was added in version 5.3.3 4 of the PlantUML Plugin.
Parameter
Parameter datasource is required, all others are optional.
Name
Description
datasource
Name of datasources to visualize
Datasources must be configured by a Confluence administrator before they can be used. A short guide can be found here.
schemaName
Name of schema to visualize. The table name is prefixed with the schema name if none is selected.
tableTypes
Comma separated list of types to show in graphics. It depends on the database which types are availableThe available types depend on the database. They can be determined with the database-info macro.Common ones are:
TABLE (default)
VIEW
INDEX
SEQUENCE
Macro database-info gives a list of available typesThe type will be shown as stereotype above the table name if more than one is selected.
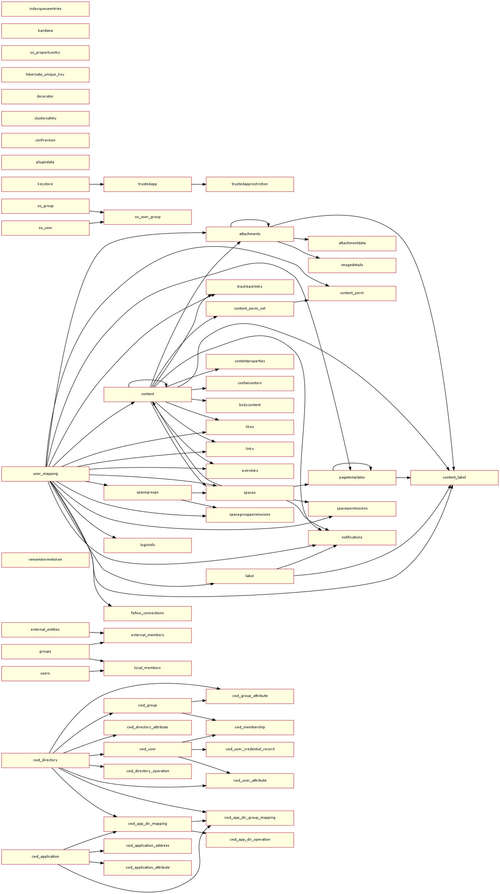
tableNameFilter
Show only tables with these names in generated graphic.
Wildcards _ and % can be used as in a SQL SELECT. An additional filtering is possible with tableNameRegEx.
Note
This selection is done inside the database. It will be faster than tableNameRegEx in most cases.
It depends on the database whether this is case sensitive or case insensitive
columnNameFilter
Show only columns with these names in generated graphic.
It works like tableNameFilter.
tableNameRegEx
Show only tables with these names in generated graphic.
Table names are defined as regular expression, e.g. show all tables whose names start with A,B,C or D or end with NEW:
Code Block
([A-D].*|.*NEW)
Note:
tableNameFilter is executed before tableNameRegEx
Regular expressions are case sensitive but you can place (?i) in front to make them insensitive
| does not work in Confluence 3 as this character separates paramters. It requires Confluence 4.
columnNameRegEx
Show only columns with these names in generated graphic.
It works like tableNameRegEx.
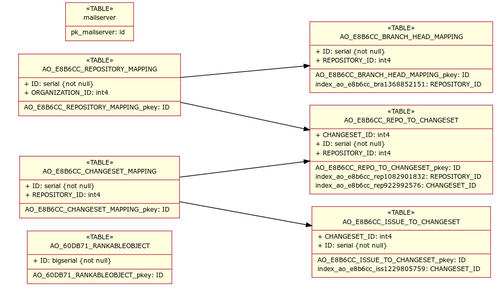
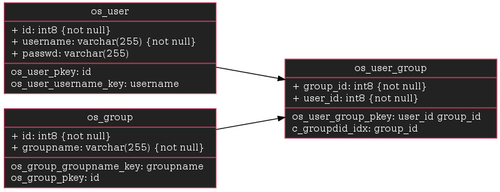
showColumns
If true column names and their data types are shown.
showComments
If true and column comments exists they will be shown after --.
(available since 5.4.1)
showDefaultValues
If true and default values exist they will be shown after =.
(available since 5.4.1)
showIndexes
If true the indexes of each table are shown below the column names.
Indexes can also be shown by adding INDEX to the list of tableTypes but this will need more space on the graphic.
nodeFontsize
Font size. Default is 9.
additional
The appearance of the graphics can be changed by adding some DOT commands here. This will overwrite the default set by the macro.
Example: set minimal width of all table boxes to 3.5 inches, change background, font colour and font: