Purpose
Visualize the structure of a database.Available since
This macro was added in version 5.3.3 of the PlantUML Plugin.
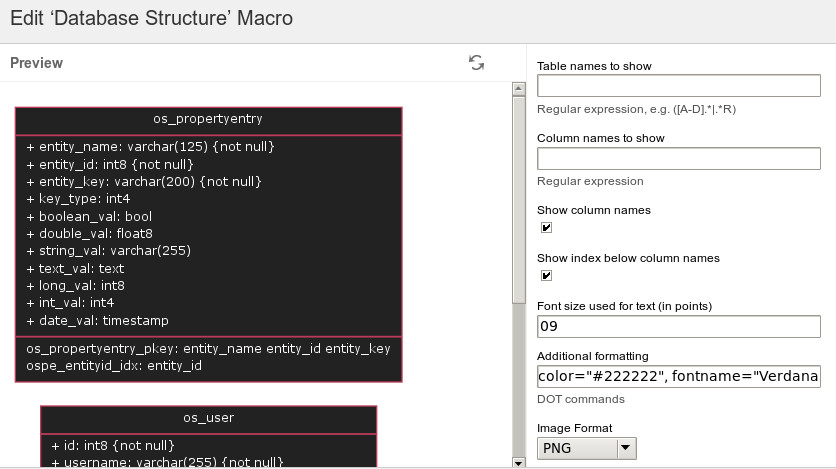
Parameter
Parameter datasource is required, all others are optional.
| Name | Description |
|---|---|
| datasource | Name of datasources to visualize
|
| schemaName | Name of schema to visualize. |
| tableTypes | Comma separated list of types to show in graphics.
Macro database-info gives a list of available types. |
| tableNameFilter | Show only tables with these names in generated graphic. Wildcards _ and % can be used as in a SQL SELECT. An additional filtering is possible with tableNameRegEx. Note
|
| columnNameFilter | Show only columns with these names in generated graphic. It works like tableNameFilter. |
| tableNameRegEx | Show only tables with these names in generated graphic. Table names are defined as regular expression, e.g. show all tables whose names start with A,B,C or D or end with NEW: ([A-D].*|.*NEW) Note:
|
| columnNameRegEx | Show only columns with these names in generated graphic. It works like tableNameRegEx. |
| showColumns | If true column names and their data types are shown. |
| showIndexes | If Indexes can also be shown by adding |
| nodeFontsize | Font size. Default is 9. |
| additional | The appearance of the graphics can be changed by adding some DOT commands here. This will overwrite the default set by the macro. Example: set minimal width of all table boxes to 3.5 inches, change background, font colour and font: node [ width="3.5", fontcolor="#FFFFFF", fillcolor="#222222", fontname="Serif"]; For more details see http://www.graphviz.org/doc/info/attrs.html
|
| format | SVG PNG |
| exportName | The graph will be stored as attachment if exportName is given. |
| debug | true = Enable debugging. |
Sample Images
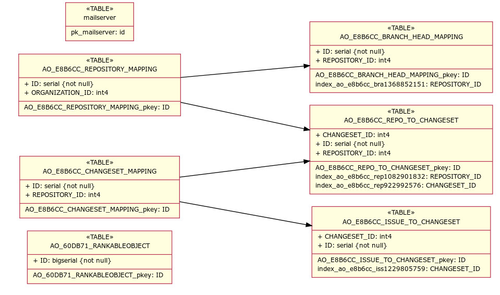
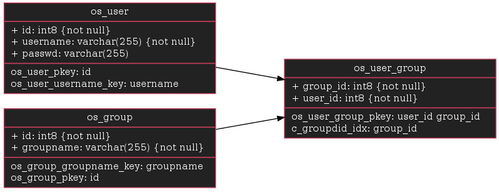
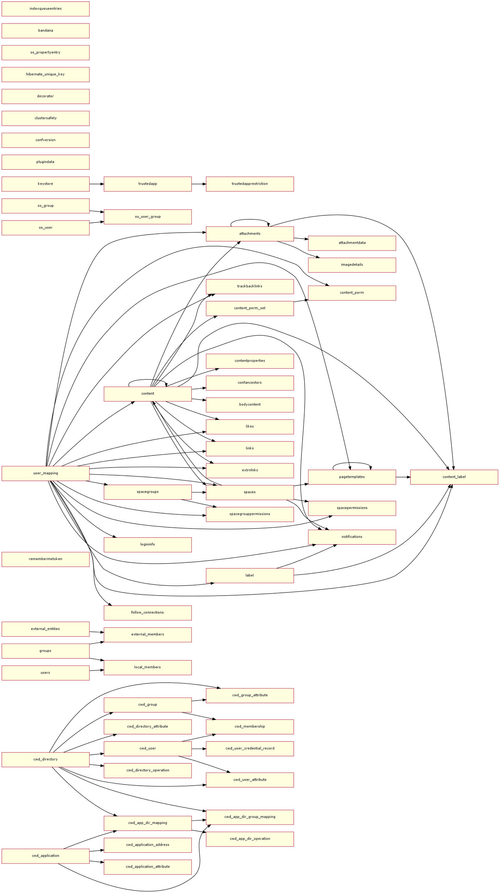
Sample Code
{database-structure:datasource=jira|showIndexes=true|showColumns=false}
{database-structure:datasource=confluence|schemaName=public|tableTypes=TABLE|tableNameFilter=os_%|nodeFontsize=11|
                    additional=node [ width="3.5", fontcolor="#FFFFFF", fillcolor="#222222", fontname="Serif"];}
Macro Browser
Logging
You can increase the logging output which is sent to $confluence.home/log/atlassian-confluence.log to see what happens inside the macro.
- Class/Package Name: de.griffel.confluence.plugins.plantuml
- Loglevel INFO will output
- DOT file from which the graphic is generated
- measurements how long it took to retrieve tables, columns, foreign keys and who long it took to create DOT and graphic
- Loglevel DEBUG will additionally output
- each table, column, foreign key and idex which was retrieved from the database